Gardening is probably the last thing on your mind as Thanksgiving weekend wraps up and we head full-speed towards the December holidays, but a brand-new USDA Hardiness Zone Map was released November 15, something that hasn’t happened for over ten years.
Considering that time span, it’s not surprising that there are some changes – mainly slight – for our area. The USDA says that compared to 2012, the 2023 map reveals that about half the country shifted to the next warmer half zone, while the other half of the country remained in the same half zone. This means that the areas which shifted to a warmer zone saw an increase in temperature in the range of 0 to 5 degrees Fahrenheit.
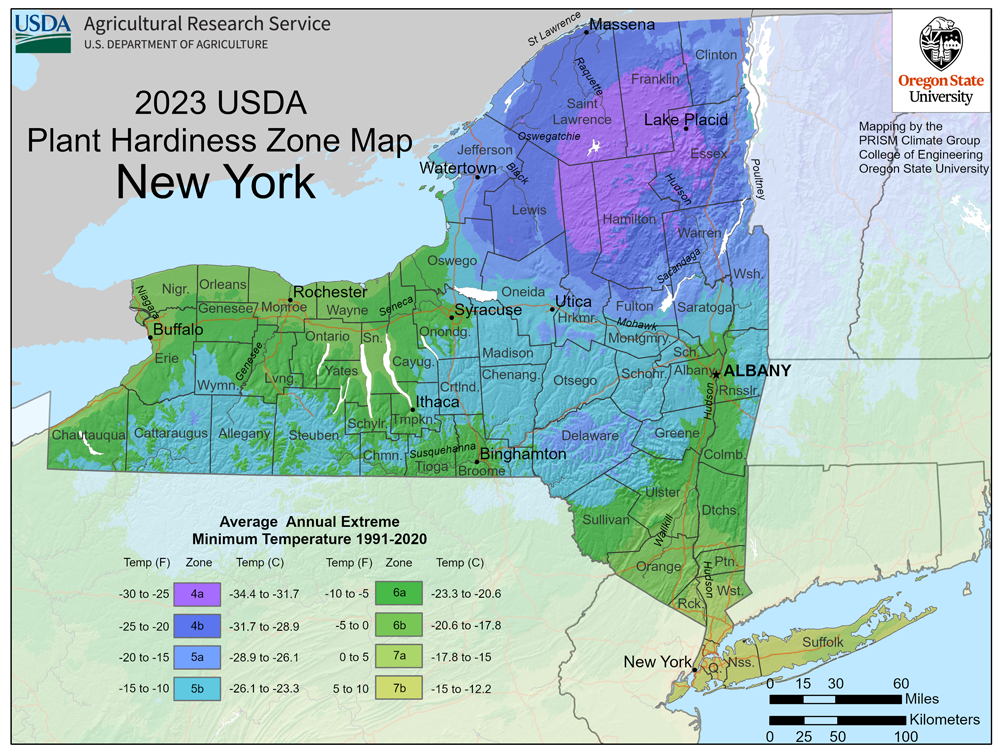
The new map is much easier to read than previous ones. It shows that local trends mirror the national trends. In 2012, the 6b Zone was limited to northern Orleans County and the northern portion of Monroe County – right along the moderating zone created by the waters of Lake Ontario. The rest of Orleans and Monroe counties was in Zone 6a. In 2012, Genesee County was split in half, with the northern portion being in 6a and the southern portion being in 5b. Most of Wyoming County was is the 5b Zone in 2012.
The new 2023 map puts the majority of Orleans County in the 6b Zone and Monroe County, as well, is mostly now in the 6b Zone. Genesee is now all mostly in 6a – meaning half the county did not change at all, but the other half did. Wyoming County now includes Zone 6a along its northern and eastern side, while the southern and western side remains in 5b.
The USDA explains that temperature updates to plant hardiness zones are not necessarily reflective of global climate change because of the, “highly variable nature of the extreme minimum temperatures of the year, as well as the use of increasingly sophisticated mapping methods and the inclusion of data from more weather stations.”
The USDA says global climate change is usually based on trends in overall average temperatures recorded over long time periods.
Plant hardiness zones represent what’s known as the “average annual extreme minimum temperature,” at a given location during a particular time period, the USDA says. The zone designations do not represent the coldest it has ever been or ever will be at a specific location, but averages the lowest winter temperature for the location over a specified time.
This information is important for gardeners because the low temperature during the winter months is a major factor in which plants will survive in specific locations.
For Zone 5b, the minimum temperature is -15 to -10 degrees Fahrenheit; for Zone 6a, the minimum temperature is -10 to -5 degrees Fahrenheit, and for Zone 6b, the minimum temperature is -5 to 0 degrees Fahrenheit.
The new map was developed jointly by USDA’s Agricultural Research Service (ARS) and Oregon State University’s (OSU) PRISM Climate Group. The USDA says the map is more accurate and contains greater detail than prior versions. The 2023 map includes data from 13,412 weather stations as compared to 7,983 stations used for the 2012 map.
The map, as well as additional information for gardeners and growers can be found at https://planthardiness.ars.usda.gov/.